Normally, I like infographics. Used correctly, they convey a lot of useful information in an understandable format. However, they can be misused.
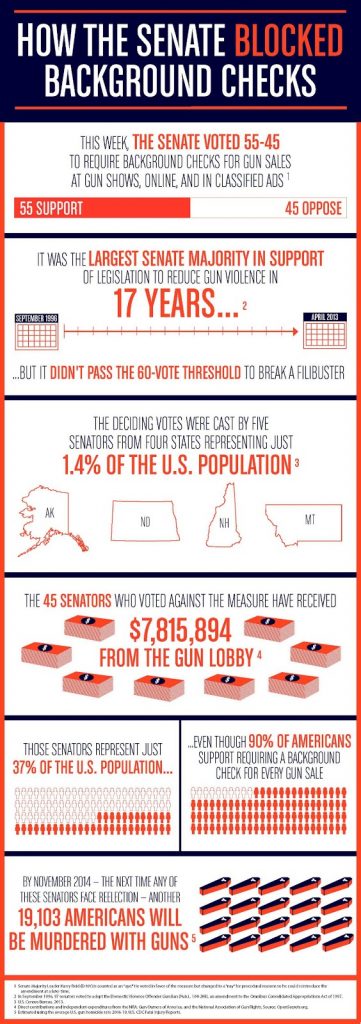
An example of infographic misuse is shown below. It comes from Mayor Bloomberg’s Illegal Mayors and their Demand Action project.
What the infographic doesn’t tell you is that Harry Reid (D-NV) set the bar at 60 votes for any amendment to S. 649 to forestall any efforts at a filibuster. It was part of the motion to proceed to consideration of the bill and to accelerate the discussion. Otherwise, there would have been 30 hours of debate and Harry Reid didn’t want the details of Manchin-Toomey subjected to that much sunlight.
Moreover, their argument that five senators representing four states which comprise 1.4% of the US population is specious. You could make the equally valid argument that the six senators from three states – Vermont, Rhode Island, and Delaware – put Manchin-Toomey over the 50 vote mark. These three states, by the way, represent a mere 0.8% of the US population.
Jame Taranto of the Wall Street Journal in his Best of the Web Today column calls these efforts “a thuggish majoritarian rhetoric”. It helps put this infographic – which is nothing but authoritarian propaganda – into perspective.

