Every Picture Tells A Story, Part Four

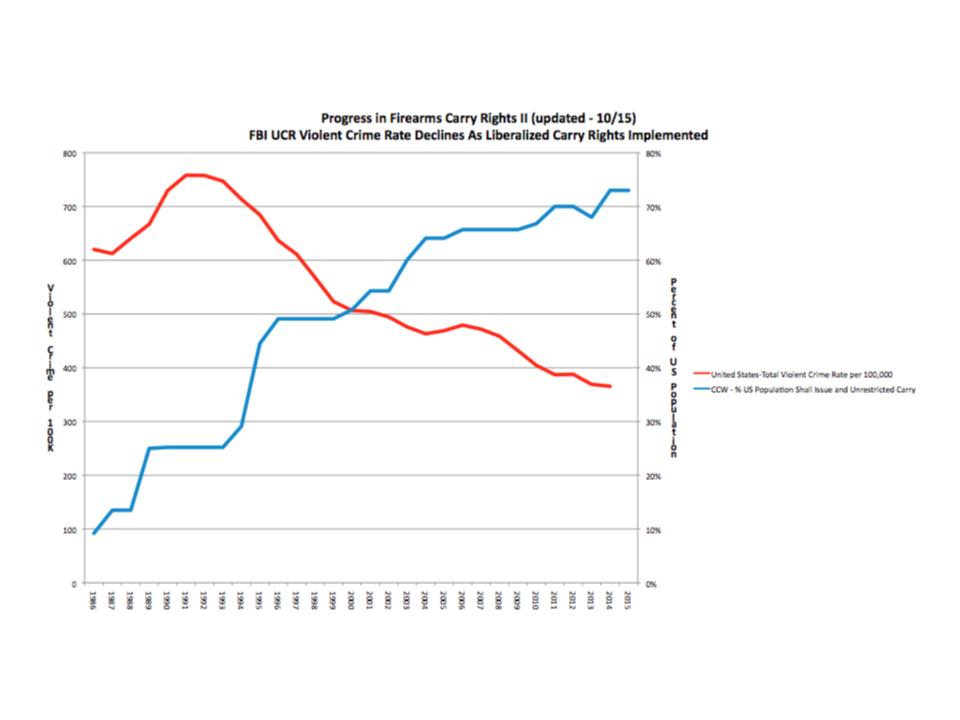
I published Every Picture Tells A Story, Part Three last Wednesday. It was an update of the 2011 post that tracked the spread of firearms freedom as evidenced by the growth in shall-issue and constitutional carry. It was released on October 15th to commemorate the effective date of constitutional carry in the state of Maine.

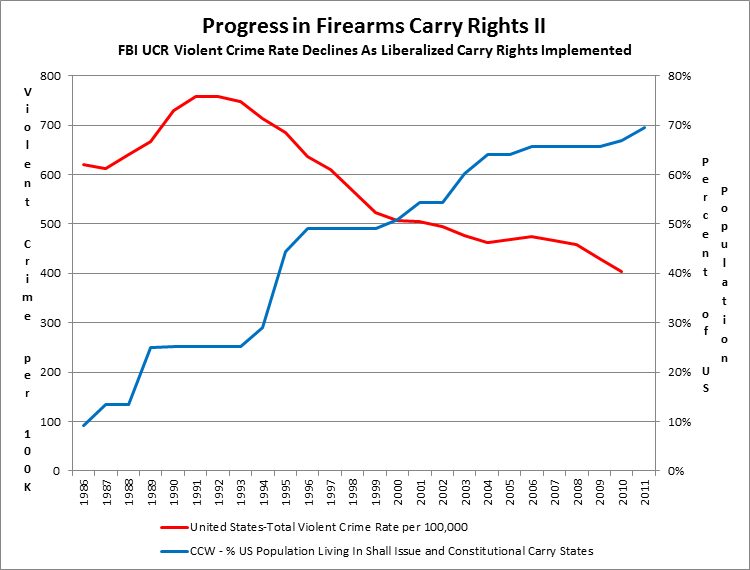
Also published in 2011 was another collaboration with Rob Vance called Every Picture Tells A Story, Part Two which plotted annual FBI violent crime rates against the growth of shall-issue concealed carry. We explicitly stated back then that there wasn’t a positive correlation between violent crime rates and liberalized carry laws. We also said that proving a negative correlation would take more a more rigorous statistical approach. However, we took note of Linoge’s work regarding the negative correlation between crime involving firearms and gun ownership. I would note that Linoge has updated his work and the negative correlation is even stronger in 2015 (-0.8016) than in 2011.

Rob has updated his graph to reflect the changes since 2011 in both crime rates and the growth of shall-issue and constitutional carry.

When Illinois, the fifth largest state in the US, was forced to adopt shall-issue concealed carry, the anti-rights movement predicted blood in the streets of Chicago and elsewhere in Illinois. That is, more blood than is normal in Chicago with its long history of stringent gun control. The graph above normalizes the crime rates as per 100,000. If shall-issue concealed carry would have caused an increase in crime rates in Illinois, it would have shown up in the graph.

Rob notes this about the graph and what it illustrates:

Every time the citizens of our states manage to convince their legislators that individual self-defense via unrestricted or shall issue concealed carry is the best approach, the press repeats the shibboleth that such laws will result in “blood in the streets.” Well, the press has been wrong about that, and they’ve been wrong repeatedly and over many many years. Then again, newspaper circulation is down and this kind of lazy reporting might be one of the reasons why. Violent crime rates, including the murder rates, are down in the United States from a peak in the early 1990’s, but you wouldn’t know it from our press. The diagram below starts with data gathered to demonstrate the change in state laws in favor of no or de minimis regulation of concealed carry of firearms for self-defense (https://docs.google.com/spreadsheets/d/1QxBfs9acTUH8hL1OtkitcivuCzr4IQKjKOQ4_obK61c/pubhtml), and integrates FBI Uniform Crime Reporting data on the national level of violent crime over time.

Concealed carry laws matter because they change the balance of power in the favor of law abiding citizens over violent criminals, increasing both the real and the perceived risk associated with criminal behavior. Over the last 25 plus years the rate of violent crimes in the US has fallen substantially, and this change runs directly counter to the increasing availability of concealed carry as a self-defense option for Americans. We are now experiencing lowered rates of violent crime last seen in the early 1970s and murder rates from the mid-1960s. As John Lott has written (extensively I might add), “More Guns = Less Crime.” Correlation isn’t causality is a truth from statistics; yet it is entirely truthful to say that the normalization of armed self-defense is taking place in a period when the rate of violent crime is falling in the US. Any other conclusion does not follow the data.

Links to our data sources are below:

http://www.pewresearch.org/fact-tank/2015/04/17/despite-lower-crime-rates-support-for-gun-rights-increases

https://www.fbi.gov/about-us/cjis/ucr/ucr

http://www.disastercenter.com/crime/uscrime.htm

Every Picture Tells A Story, Part Two (Repost)

The gun prohibitionists are already saying that blood will run in the streets when the Illinois General Assembly crafts some form of concealed carry legislation in accordance with today’s ruling by Judge Richard Posner of the 7th Circuit Court of Appeals.

“As the dissenting opinion points out, the two judges who threw out
Illinois’ law did not take account of the danger to the public from
stray bullets, and they ignored the Illinois legislature’s determination
that carrying weapons has been shown to escalate violence,” said Lee
Goodman, an organizer with the Stop Concealed Carry Coalition.

If Lee had taken the time to examine the graphic below, he would see that there is no positive correlation between less-restrictive (legal) carry (shall issue and constitutional issue) and increased violent crime. Let’s face it – Chicago already has concealed carry by thugs and criminals. The only ones prohibited from protecting themselves are honest, law-abiding citizens.

This was originally posted on Dec. 21, 2011.

In October, I posted a graphic developed by Rob Vance that showed the progress in the growth of firearms carry rights from 1986 through 2011 as a percentage of the U.S. population. In 1986, 90% of the U.S. population lived in states that severely restricted carry rights or had none at all. Today, over two-thirds of Americans live in states with either shall-issue carry or constitutional carry. The conclusion was that shall-issue is the new norm.

Recently, the FBI released its Uniform Crime Reports statistics. Rob generated a new graph plotting these violent crime rates against the growth of less-restrictive firearm carry rights over the period of 1986 through 2011.

The data used to generate this graph is available here in Google documents. As I said in the original post, unlike the gun prohibitionists, we publish our data for the world to see. The data used comes from three sources: the FBI Uniform Crime Reports, the U.S. Census, and www.gun-nuttery.com/rtc.php which tracked the changes in carry laws over time.

Rob had the following conclusions after examining the data:

Violent crime is a complex issue, but national data is clear that there is no positive correlation between liberalized concealed carry laws and increased violent crime.

The “blood in the streets” or “Wild West” scenarios just don’t play out. To be fair, state level data is highly variable, so some caution needs to be exercised in drawing conclusions.

Rob is very explicit that there is no positive correlation between violent crime and liberalized carry laws rather than a proven negative correlation. He feels that it will take more rigorous statistical analysis before this negative correlation could be said to be proven.

The results here are reinforced by the study done by Linoge at Walls of the City which compared violent crime rates and firearm ownership. In that study, Linoge did find a relatively strong negative (-0.605) correlation between violent crime and firearm ownership.
 
While violent crime did not go down as sharply as the progress in carry rights rose, one thing that needs to be kept in mind is that while shall-issue may be the new norm that right is not extended to all locations. Bars, restaurants, government buildings, post offices, and many parks are still off-limits to concealed carry. I think this will become the next battleground for concealed carry. Interestingly enough, restrictive states like California actually have fewer restrictions on where one may carry.

As an example of the battle for fewer restricted locations, one need look no further than here in North Carolina. This session of the General Assembly changed the law concerning concealed carry in state, municipal, and county parks. It is now allowed everywhere with the exception of a local opt-out for “recreational facilities”. As might be expected, some locales are trying to push the limit on what is considered a recreation facility far beyond what was intended by the General Assembly.

Shall-issue may be the new norm but the fight will continue.

NOTE: If you click on the graphic, you can view it in its full original size.